Let me know
LS Optimizer
Let me know
xyExtract Graph Digitizer
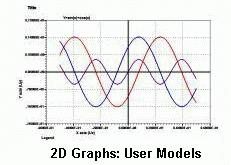
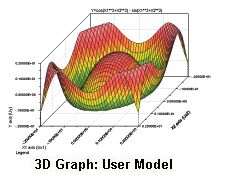
Contour Map
2D Parametric Graph
2D Animation
3D Animation

Top
|


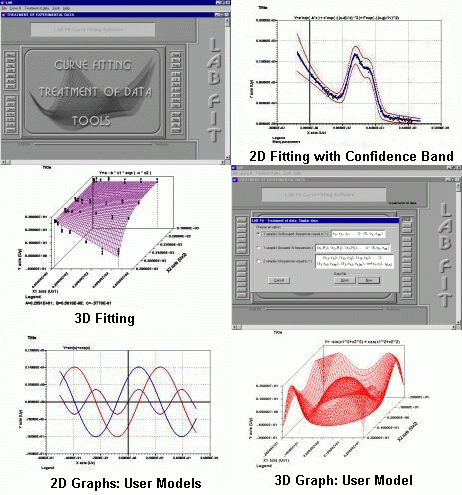
 LAB Fit Curve Fitting Software

Alias:
LABFit Curve Fit, LABFIT Ajuste de Curvas, Labfit Least Squares, labfit Kurvenanpassung, LabFit treatment of experimental data and LAB FIT Minimos Quadrados.
Keywords:
curve fitting, error propagation, non-linear regression, multivariate, 2D 3D graph, confidence band, basic statistics, least squares, extrapolation, chi-square, correlation coefficient, covariance matrix, differential equation, system of differential equations.
Description:
LAB Fit is a software for Windows developed for treatment and analysis of experimental data. At LAB Fit you are able to:
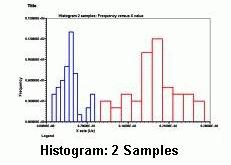
1) Treat similar data (grouped and ungrouped dataset, two samples);
2) Treat non-similar data;
3) Calculate probabilities for many distributions (Gaussian, t-Student, Fisher-Snedecor, Chi-Square and Correlation Coefficient);
4) Determine propagated error (error propagation, up to eight independent variables);
5) Plot graphs (2D and 3D) (normal, parametric, imported dataset, contour of maps);
6) Execute calculations: system of linear equations, roots of function, nonlinear equation, ordinary differential equation (numerical method - RK4, ODE up to fifth order), system of ordinary differential equations (first order ODE, up to five equations), approached function for ODE solution, calculator, etc;
7) Extract data (x;y) from a 2D graph (digitizing with "xyExtract Graph Digitizer");
8) Curve Fitting (nonlinear regression - least squares method, Levenberg-Marquardt algorithm -, almost 500 functions at the library with one and two independent variables, functions finder, option that let you write your own fitting function with up to 150 characters, 6 independent variables and 10 parameters).
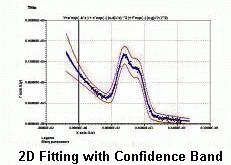
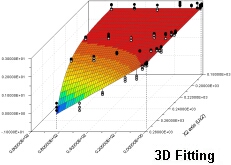
LAB Fit has a menu for curve fitting and the main programs of this menu use nonlinear regression. LAB Fit fits functions of one and several independent variables (from 1 up to 6), admitting uncertainties at the dependent variable (Y) and also at the independent variables (X). In case of uncertainties in X and in Y it's made a pre-fit not considering the uncertainties in X, that later on are transferred to Y by error propagation. At LAB Fit library there are more than 200 functions with 1 independent variable and almost 280 functions with 2 independent variables. The user disposes of a finder functions program. If necessary, there is an option so that the user can write its own fit function. Once determined the fit parameters, it's possible to extrapolate the fit function and, for the 2D and 3D cases, the graph of the obtained function is shown. For the 2D case, beyond the extrapolation possibility, the user can even include error bar and confidence band to the graph.
LAB Fit has also a menu destined to the treatment of similar data, non-similar data and error propagation. Beyond that, there is a third menu with general tools like to plot a function informed by user and many other types of calculations.
And more: reading option for to extract data from a 2D graph (digitizer for orthogonal and nonorthogonal axes) contained in a graphic file (graph digitizing).
LAB Fit Working - Videos (Examples, 58 s): Video 1 Video 2 Video 3
|
LAB Fit - Images and Graphs (Examples): Graphs
|
LAB Fit - Curve Fitting (Examples): Fitting
|
LAB Fit - Basic Statistics (Examples): Statistics
|
LAB Fit - Tools (Examples): Tools
|
LAB Fit - Certification: StRD / NIST
The LAB Fit performance has been verified with the Statistical Reference Datasets Project (StRD)
of the National Institute of Standards and Technology (NIST). The StRD presents 27 datasets with three levels of difficulty:
Lower Average Higher
All the 27 LAB Fit results are statistically identical to the certified values.
|
Download URLs:
|
LAB Fit Curve Fitting Software Help Files
|
|


