This video shows how to obtain the histogram of the residuals from a curve fit using LAB Fit
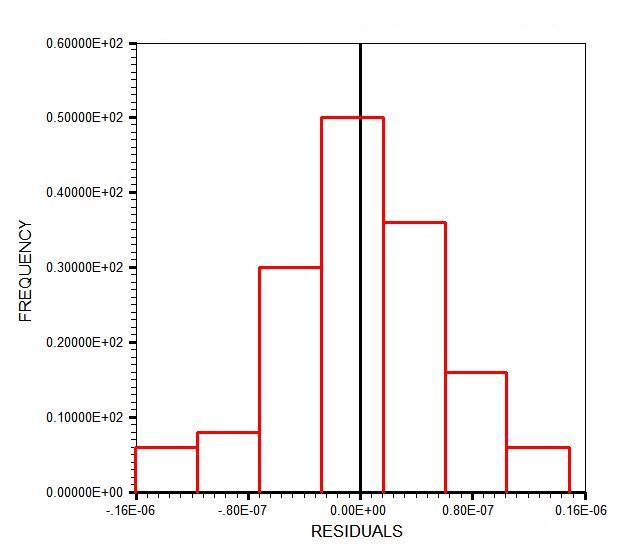
The exponential function (function no. 11) will be fitted to the dataset "Histogram Curve Fit Function 11.txt" (which is already open), and once the fit is complete, the residuals will be presented as a histogram, as shown in the following video.
See the figure with the histogram below, which can be edited using, for example, Paint: