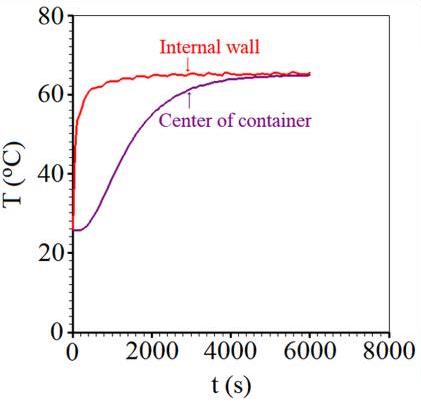
Figure 1. Temperatures at the center of the parallelepiped-shaped container
with green coconut pulp and at its internal wall.
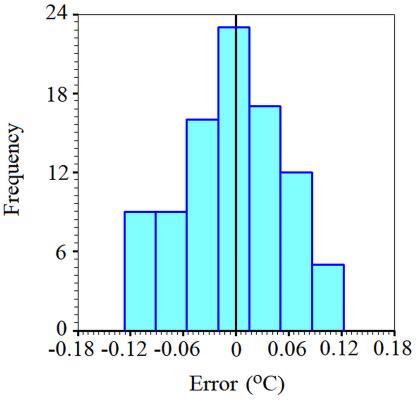
Figure 5. Histogram: frequency versus error.
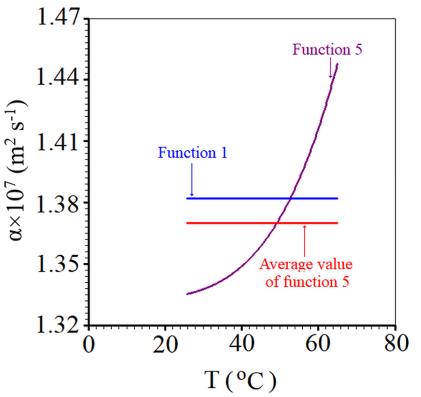
Figure 6. Thermal diffusivity as function of the local temperature (Function 5),
its average value, and constant thermal diffusivity (Function 1).
A diffusion model to describe water absorption by red rice during soaking: Variable mass diffusivity, variable volume, use of boundary-fitted coordinates
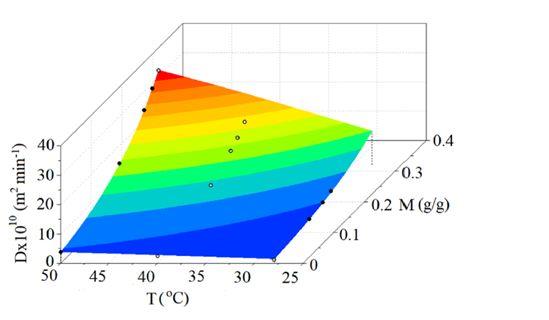
Figure 5. The mass diffusivity D for water absorption by husked red rice as a
function of the temperature T and the local moisture content M.
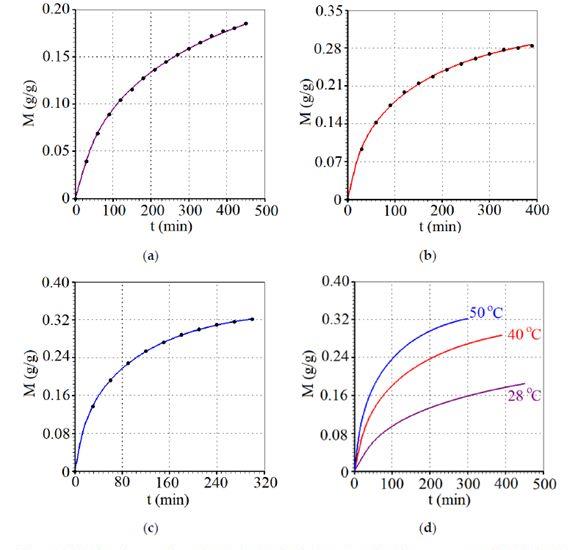
Figure 6. Kinetics of water absorption by husked red rice at the following temperatures T (°C):
(a) 28.0 (magenta); (b) 40.0 (red); and (c) 50.0 (blue); (d) Superposition of the three kinetics.
Osmotic dehydration of pineapple (Ananas comosus) pieces in cubical shape described by diffusion models
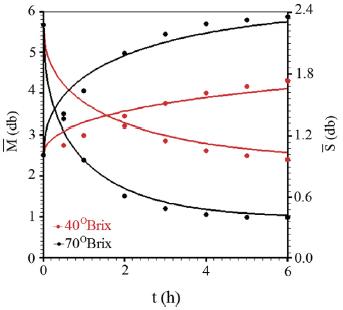
Fig. 1. Water and solid migration kinetics described by model 1 for the concentrations of 40 and 70 °Brix.
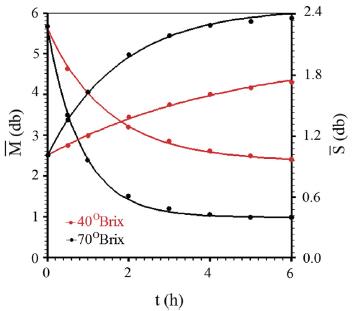
Fig. 2. Water and solid migration kinetics described by model 2 for the concentrations of 40 and 70 °Brix.
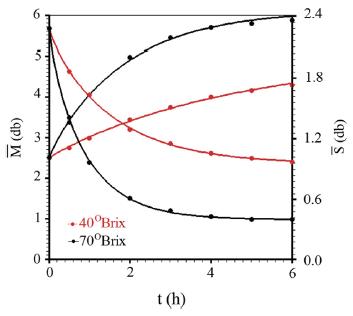
Fig. 3. Water and solid migration kinetics described by model 3 (Eqs. (7) and (20)) for the concentrations of 40 and 70 °Brix.
Drying description of cylindrical pieces of bananas in different temperatures using diffusion models
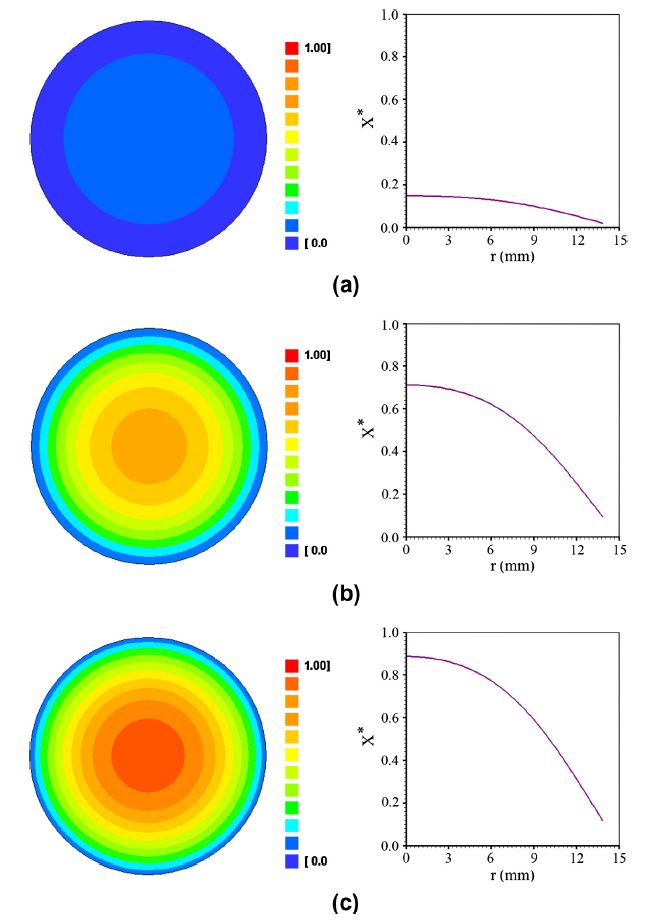
Fig. 8. Contour plot and graph representing the dimensionless moisture distribution within the cylinder for the drying process at T = 50 °C and t = 465 min, in the
following positions: (a) upper circle; (b) circular section at a distance L/4 of the midpoint of the cylinder; and (c) circular section at the midpoint of the cylinder.
Mathematical Models to Describe the Foam Mat Drying Process of Cumbeba Pulp (Tacinga inamoena) and Product Quality
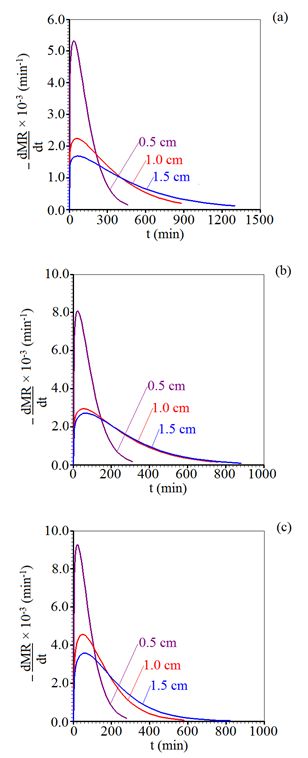
Figure 2. Effect of air temperature and sample thickness on the evolution of the
drying rate of the foams correspond to (a) 50, (b) 60, and (c) 70 °C, respectively.
Convective drying of osmo-dehydrated apple slices: kinetics and spatial behavior of effective mass diffusivity and moisture content
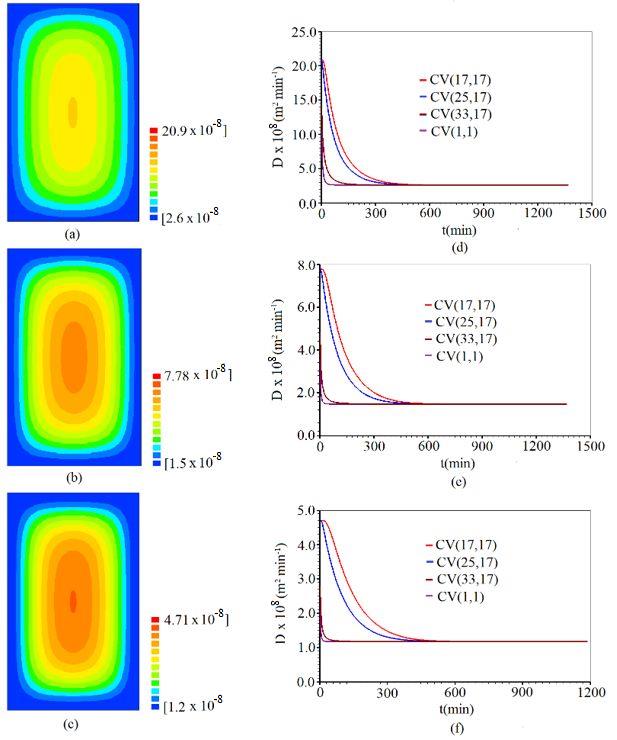
Fig. 5 Contour maps for the effective mass diffusivities of water 1 h after the beginning of the convective drying at 40 °C for
(a) fresh fruit sample; (b) osmodehydrated sample at 40 °C 40 °Brix; (c) osmodehydrated sample at 40 °C 60 °Brix and time evolution
of effective mass diffusivities in specific control volumes for (d) fresh fruit sample; (e) osmodehydrated sample at 40 °C 40 °Brix;
(f) osmo-dehydrated sample at 40 °C 60 °Brix.
Calculation of the convective heat transfer coefficient and thermal diffusivity of cucumbers using numerical simulation and the inverse method
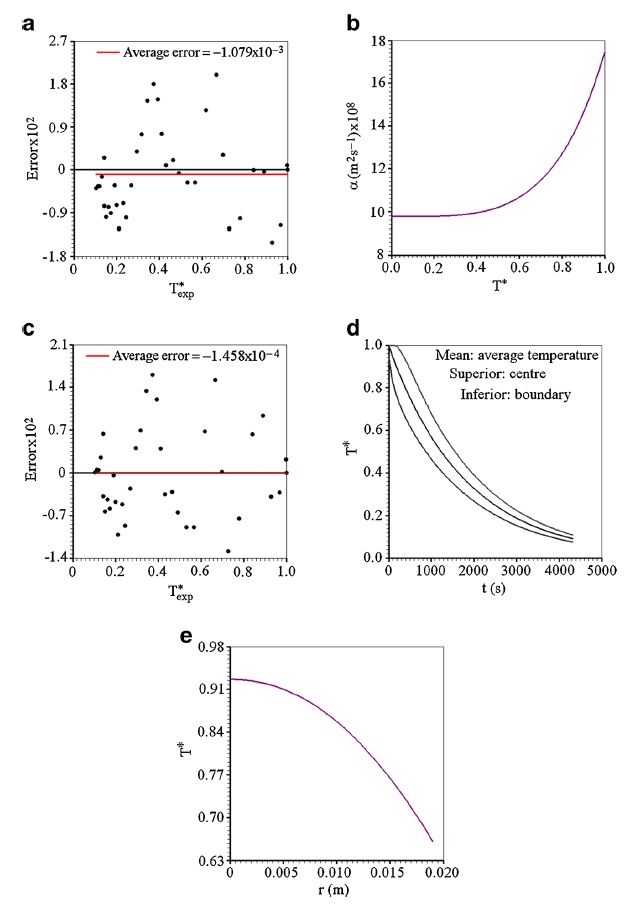
Fig. 5 a) Dispersion and average error for constant diffusivity; b) Variable thermal diffusivity versus dimensionless temperature; c) Dispersion and average error for variable diffusivity;
d) Dimensionless temperatures: average, in the centre and on boundary; e) Graph of the dimensionless temperature versus radial position after 402 s of cooling.
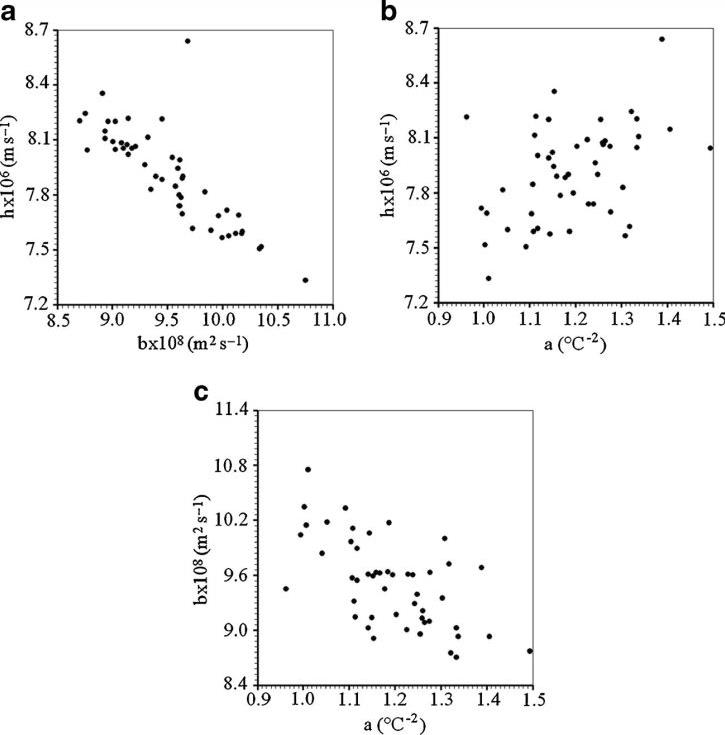
Fig. 6 Dispersions between the parameters for the 50 virtual results: a) h and b; b) h and a; c) b and a.
Estimation of thermo-physical properties of products with cylindrical shape during drying: The coupling between mass and heat
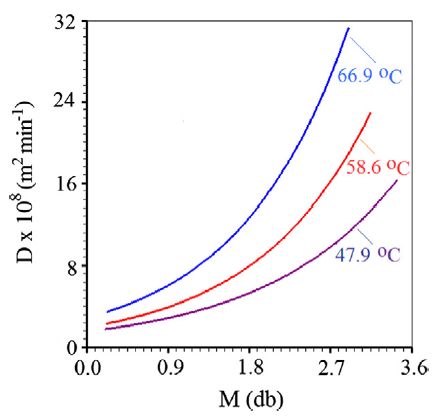
Fig. 4. Effective moisture diffusivity as a function of the local moisture content at drying air temperature of: (a) 47.9 °C; (b) 58.6 °C; (c) 66.9 °C.
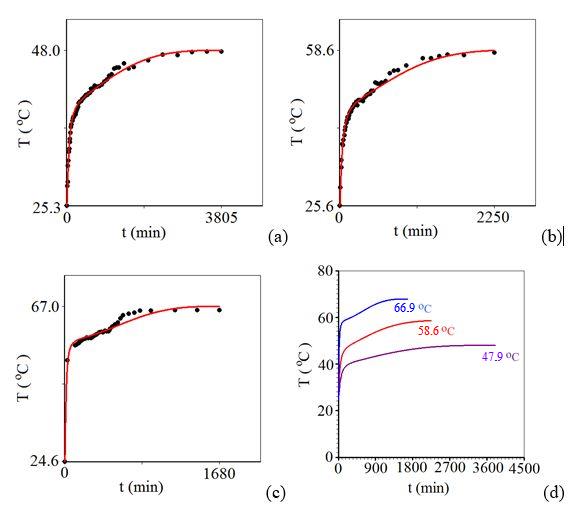
Fig. 6. Temperature in the center of the banana at drying air temperature of: (a) 47.9 °C; (b) 58.6 °C; (c) 66.9 °C; (d) superposition of the simulated curves.
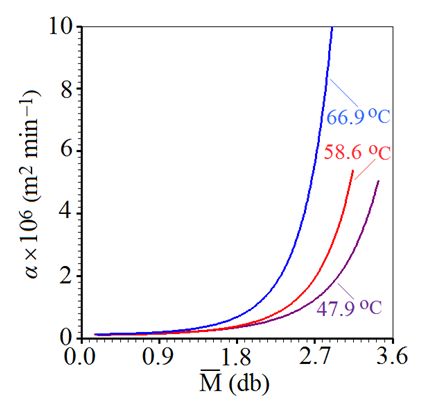
Fig. 7. Thermal diffusivity as a function of the average moisture content at drying air temperature of: (a) 47.9 °C; (b) 58.6 °C; (c) 66.9 °C.
See some articles written by the LAB Fit author and his students (some of them are "open access"), available at: ORCID