See below the removal of experimental point number 12 from the file Untitled.txt and a new rejection test following the removal.
It can be observed that Untitled.txt file has no outliers (it is clean now), and the function Y = A * X + B can be fitted to this final dataset with 46 experimental points.
Note: For a fit involving few experimental points, an outlier can greatly widen the Prediction Band and go undetected, especially if the residuals do not approximate a normal distribution (even minimally*). See the fictitious example with few data points and leverage effect (Y = A * X + B):
(1, 2); (2, 4); (3, 5); (4, 7); (5, 9); (6, 45).
Visually, point (6, 45)
can be rejected (but it is a masked outlier in the fitting of Y = A * X + B)! The fit of the function to the other 5 points, with extrapolation to X=6,
shows a
"Prediction Band"
that corroborates the visual removal.
*To view a histogram of the curve-fitting residuals, follow this path after completing and closing the fit: Treat button => Similar data - Histogram: 1 sample (grouped and ungrouped) and 2 samples => OK => 1 sample (Ungrouped: frequencies equal to 1) => Open => Last Fitting Residuals.txt => Open => OK => OK.
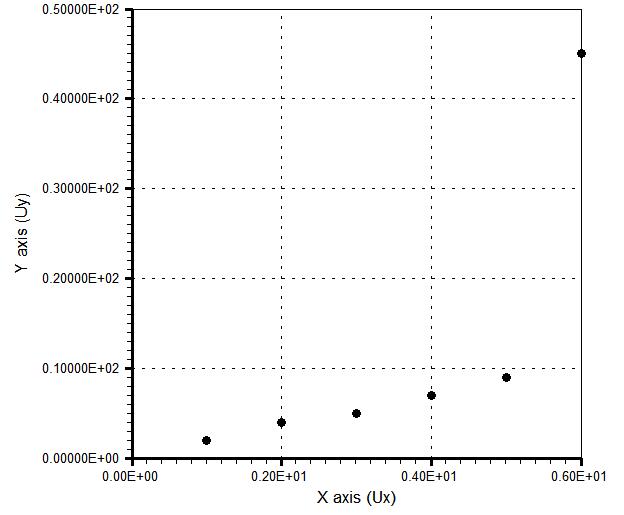 can be rejected (but it is a masked outlier in the fitting of Y = A * X + B)! The fit of the function to the other 5 points, with extrapolation to X=6,
shows a
"Prediction Band"
can be rejected (but it is a masked outlier in the fitting of Y = A * X + B)! The fit of the function to the other 5 points, with extrapolation to X=6,
shows a
"Prediction Band"
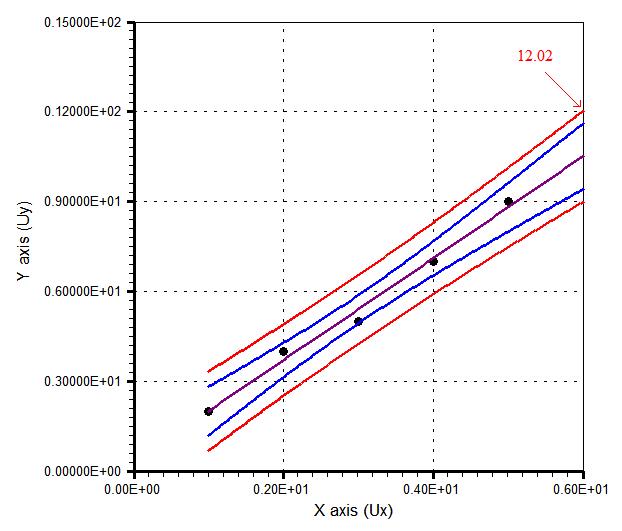 that corroborates the visual removal.